Introduction to the dataRetrieval package
Laura A. DeCicco and Robert M. Hirsch
16 July, 2026
Source:vignettes/dataRetrieval.Rmd
dataRetrieval.RmdThe dataRetrieval package was created to simplify the
process of loading hydrologic data into the R environment. It is
designed to retrieve the major data types of U.S. Geological Survey
(USGS) hydrologic data that are available on the Web, as well as data
from the Water Quality Portal (WQP), which currently houses water
quality data from the Environmental Protection Agency (EPA), U.S.
Department of Agriculture (USDA), and USGS. Direct USGS data is obtained
from a service called the USGS Water Data API.
For information on getting started in R and installing the package, see Getting Started. Any use of trade, firm, or product names is for descriptive purposes only and does not imply endorsement by the U.S. Government.
A quick workflow using dataRetrieval functions:
library(dataRetrieval)
# Choptank River near Greensboro, MD
siteNumber <- "USGS-01491000"
ChoptankInfo <- read_waterdata_monitoring_location(siteNumber)
parameterCd <- "00060"

# Raw daily data:
rawDailyData <- read_waterdata_daily(monitoring_location_id = siteNumber,
                                     parameter_code = parameterCd,
                                     time = c("1980-01-01", "2010-01-01"))


pCode <- read_waterdata_parameter_codes(parameter_code = parameterCd)
USGS Data API Access Tokens
USGS data are made available through the USGS water data APIs. You can register an API key for use with USGS water data APIs. There are now limits on how many queries can be requested per IP address per hour. If you find yourself running into limits, you can request an API token here: https://api.waterdata.usgs.gov/signup/
Then save your token in your .Renviron file like this:
API_USGS_PAT = "my_super_secret_token"You can use usethis::edit_r_environ() to edit find and
open your .Renviron file. You will need to restart R for that variable
to be recognized.
Table 1 describes the functions available in the
dataRetrieval package.
| Name | Data Returned | Source |
|---|---|---|
| read_waterdata | Time series data using user-specified queries | USGS Water Data API |
| read_waterdata_daily | Daily values | USGS Water Data API |
| read_waterdata_continuous | Instantaneous values | USGS Water Data API |
| read_waterdata_rating | Rating table for active streamgage | USGS Water Data API |
| read_waterdata_field_measurements | Surface-water measurements | USGS Water Data API |
| read_waterdata_peaks | Peak flow | USGS Water Data API |
| read_waterdata_field_measurements | Groundwater levels | USGS Water Data API |
| readNWISuse | Water use | NWIS |
| read_waterdata_stats_por, read_waterdata_stats_daterange | Statistical service | USGS Water Data API |
| read_waterdata_parameter_codes | Parameter code information | USGS Water Data API |
| read_waterdata_monitoring_location | Site information | USGS Water Data API |
| read_waterdata_samples | Discrete UGSS water quality data | USGS Samples Data |
| summarize_waterdata_samples | Discrete USGS water quality summary | USGS Samples Data |
| read_waterdata_combined_meta | Site search using user-specified queries | USGS Water Data API |
| read_waterdata_ts_meta | Data availability | USGS Water Data API |
| readWQPdata | User-specified queries | WQP |
| readWQPqw | Water quality data | WQP |
| whatWQPsites | Site search | WQP |
| whatWQPdata | Data availability | WQP |
| readWQPsummary | Summary data | WQP |
| whatWQPmetrics | Metric availability | WQP |
| whatWQPsamples | Sample availability | WQP |
The arguments startDate and endDate have
defaults to request the maximum data.
USGS Web Retrievals
In this section we’ll show how to get raw data into R. This data includes site information, measured parameter information, historical daily values, unit values (which include real-time data but can also include other sensor data stored at regular time intervals), groundwater level data, peak flow data, rating curve data, surface-water measurement data, water use data, and statistics data. The section Embedded Metadata shows instructions for getting metadata that is attached to each returned data frame.
The USGS organizes hydrologic data in a standard structure.
Streamgages are located throughout the United States, and each
streamgage has a unique ID (referred in this document and throughout the
dataRetrieval package as siteNumber). Often
(but not always), these ID’s are 8 digits for surface-water sites and 15
digits for groundwater sites. The first step to finding data is
discovering this siteNumber.
Once the siteNumber is known, the next required input
for USGS data retrievals is the “parameter code”. This is a 5-digit code
that specifies the measured parameter being requested. For example,
parameter code 00631 represents “Nitrate plus nitrite, water, filtered,
milligrams per liter as nitrogen”, with units of “mg/l as N”.
Not every station will measure all parameters. A short list of commonly measured parameters is shown in Table 2.
| pCode | shortName |
|---|---|
| 00060 | Discharge [ft3/s] |
| 00065 | Gage height [ft] |
| 00010 | Temperature [C] |
| 00045 | Precipitation [in] |
| 00400 | pH |
Two output columns that may not be obvious are “srsname” and “casrn”. Srsname stands for “Substance Registry Services”. Casrn stands for “Chemical Abstracts Service (CAS) Registry Number”.
For unit values data (sensor data measured at regular time intervals
such as 15 minutes or hourly), knowing the parameter code and
siteNumber is enough to make a request for data. For most
variables that are measured on a continuous basis, the USGS also stores
the historical data as daily values. These daily values are statistical
summaries of the continuous data, e.g. maximum, minimum, mean, or
median. The different statistics are specified by a 5-digit statistics
code.
Some common codes are shown in Table 3.
| StatCode | shortName |
|---|---|
| 00001 | Maximum |
| 00002 | Minimum |
| 00003 | Mean |
| 00008 | Median |
Examples for using these site numbers, parameter codes, and statistic codes will be presented in subsequent sections.
Site Information
read_waterdata_monitoring_location
Use the read_waterdata_monitoring_location function to
obtain all of the information available for a particular USGS site (or
sites) such as full station name, drainage area, latitude, and
longitude. read_waterdata_monitoring_location can also
access information about multiple sites with a vector input.
siteNumbers <- c("USGS-01491000", "USGS-01645000")
siteINFO <- read_waterdata_monitoring_location(siteNumbers)
Site information is obtained from: https://api.waterdata.usgs.gov/ogcapi/v0/collections/monitoring-locations
read_waterdata_ts_meta
To discover what time series data is available for a particular USGS
site, including measured parameters, period of record, and number of
samples (count), use the read_waterdata_ts_meta
function.
In the following example, we limit the retrieved data to only daily data.
# Continuing from the previous example:
# This pulls out just the daily, mean data:

dailyDataAvailable <- read_waterdata_ts_meta(
  monitoring_location_id = siteNumbers,
  computation_period_identifier = "Daily",
  statistic_id = "00003"
)
Table 4: Reformatted version of output from the read_waterdata_ts_meta function for the Choptank River near Greensboro, MD, and from Seneca Creek at Dawsonville, MD from the daily values service [Some columns deleted for space considerations]
| monitoring_location_id | parameter_description | unit_of_measure | begin | end |
|---|---|---|---|---|
| USGS-01491000 | Specific conductance, water, unfiltered, microsiemens per centimeter at 25 degrees Celsius | uS/cm | 2010-10-01 | 2012-05-09 |
| USGS-01491000 | Dissolved oxygen, water, unfiltered, milligrams per liter | mg/l | 2023-04-21 | 2025-12-02 |
| USGS-01491000 | Discharge, cubic feet per second | ft^3/s | 1948-01-01 | 2025-12-02 |
| USGS-01645000 | Discharge, cubic feet per second | ft^3/s | 1930-09-26 | 2025-12-02 |
| USGS-01491000 | Suspended sediment concentration, milligrams per liter | mg/l | 1980-10-01 | 1991-09-29 |
| USGS-01491000 | Suspended sediment discharge, short tons per day | tons/day | 1980-10-01 | 1991-09-29 |
| USGS-01491000 | Nitrate plus nitrite, water, in situ, milligrams per liter as nitrogen | mg/l | 2023-08-02 | 2025-12-02 |
| USGS-01491000 | Temperature, water, degrees Celsius | degC | 2023-04-21 | 2025-12-02 |
| USGS-01491000 | Turbidity, water, unfiltered, monochrome near infra-red LED light, 780-900 nm, detection angle 90 +-2.5 degrees, formazin nephelometric units (FNU) | _FNU | 2023-04-21 | 2025-12-02 |
| USGS-01491000 | Temperature, water, degrees Celsius | degC | 2010-10-01 | 2012-05-09 |
| USGS-01491000 | Specific conductance, water, unfiltered, microsiemens per centimeter at 25 degrees Celsius | uS/cm | 2023-04-21 | 2025-12-02 |
Parameter Information
To obtain all of the available information concerning a measured
parameter (or multiple parameters), use the
read_waterdata_parameter_codes function:
# Using defaults:
parameterCd <- "00618"
parameterINFO <- read_waterdata_parameter_codes(parameter_code = parameterCd)
Daily Data
To obtain daily records of USGS data, use the
read_waterdata_daily function.
# Choptank River near Greensboro, MD:
siteNumber <- "USSG-01491000"
parameterCd <- "00060" # Discharge
startDate <- "2009-10-01"
endDate <- "2012-09-30"

discharge <- read_waterdata_daily(monitoring_location_id = siteNumber,
                                  parameter_code = parameterCd,
                                  time = c(startDate, endDate))
The column “time” in the returned data frame is automatically imported as a variable of class “Date” in R.
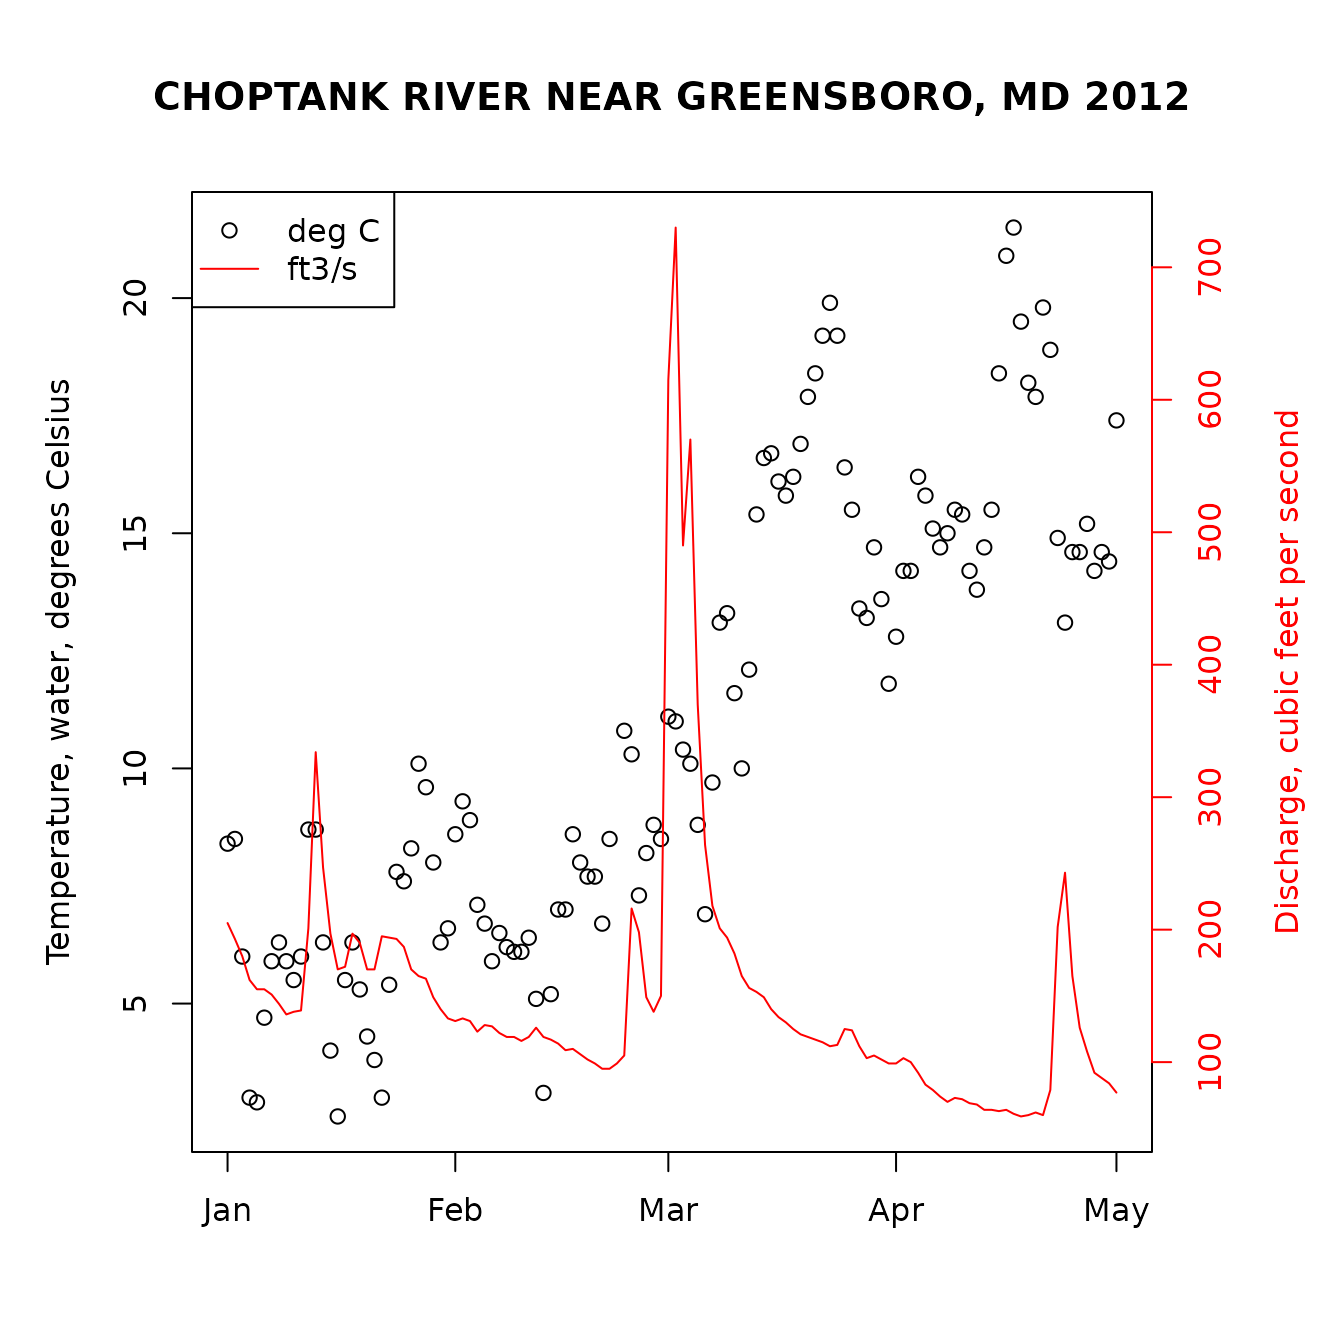
Another example would be a request for mean and maximum daily temperature and discharge in early 2012:
siteNumber <- "USGS-01491000"
parameterCd <- c("00010", "00060") # Temperature and discharge
statCd <- c("00001", "00003") # Mean and maximum
startDate <- "2012-01-01"
endDate <- "2012-05-01"

temperatureAndFlow <- read_waterdata_daily(monitoring_location_id = siteNumber,
                                  parameter_code = parameterCd,
                                  statistic_id = statCd,
                                  time = c(startDate, endDate))
An example of plotting the above data:
temperature <- temperatureAndFlow[temperatureAndFlow$parameter_code == "00010",]
temperature <- temperature[temperature$statistic_id == "00001",]

flow <- temperatureAndFlow[temperatureAndFlow$parameter_code == "00060",]

par(mar = c(5, 5, 5, 5)) # sets the size of the plot window

plot(temperature$time, temperature$value,
  ylab = "Maximum Temperture [C]",
  xlab = ""
)
par(new = TRUE)
plot(flow$time,
  flow$value,
  col = "red", type = "l",
  xaxt = "n", yaxt = "n",
  xlab = "", ylab = "",
  axes = FALSE
)
axis(4, col = "red", col.axis = "red")
mtext("Discharge [ft3/s]", side = 4, line = 3, col = "red")
title("CHOPTANK RIVER NEAR GREENSBORO, MD")
legend("topleft", unique(temperatureAndFlow$unit_of_measure),
  col = c("black", "red"), lty = c(NA, 1),
  pch = c(1, NA)
)
Unit Data
Any data collected at regular time intervals (such as 15-minute or
hourly) are known as “unit values”. Many of these are delivered on a
real time basis and very recent data (even less than an hour old in many
cases) are available through the function
read_waterdata_continuous. Here is an example of a
retrieval of such data.
parameterCd <- "00060" # Discharge
startDate <- "2012-05-12"
endDate <- "2012-05-13"
dischargeUnit <- read_waterdata_continuous(monitoring_location_id = siteNumber,
                                           parameter_code = parameterCd,
                                           time = c(startDate, endDate))
The retrieval produces a data frame that contains 96 rows (one for
every 15 minute period in the day). They include all data collected from
the startDate through the endDate (starting
and ending with midnight locally-collected time). The dateTime column is
converted to UTC (Coordinated Universal Time), so midnight EST will be 5
hours earlier in the dateTime column (the previous day, at 7pm).
Groundwater Level Data
Groundwater level measurements can be obtained with the
read_waterdata_field_measurements function.
siteNumber <- "USGS-434400121275801"
groundWater <- read_waterdata_field_measurements(monitoring_location_id = siteNumber)
Peak Flow Data
Peak flow data are instantaneous discharge or stage data that record
the maximum values of these variables during a flood event. They include
the annual peak flood event but can also include records of other peaks
that are lower than the annual maximum. Peak discharge measurements can
be obtained with the read_waterdata_peaks function.
siteNumber <- "USGS-01594440"
peakData <- read_waterdata_peaks(monitoring_location_id = siteNumber)
Rating Curve Data
Rating curves are the calibration curves that are used to convert
measurements of stage to discharge. Because of changing hydrologic
conditions these rating curves change over time. Information on the
returned data can be found with the comment function and
attached attributes as described in the metadata section.
Rating curves can be obtained with the
read_waterdata_ratings function.
ratingData <- read_waterdata_ratings(monitoring_location_id = siteNumber,
                                    file_type = "base")
comment(ratingData[[1]])
Surface-Water Measurement Data
These data are the discrete measurements of discharge that are made
for the purpose of developing or revising the rating curve.
Surface-water measurement data can be obtained with the
read_waterdata_field_measurements function.
surfaceData <- read_waterdata_field_measurements(monitoring_location_id = "USGS-01594440")Water Use Data
Legacy water use data services have been retired. Check back in for developments on replacement functions.
Statistics Data
Retrieves site statistics from the USGS Water Data
Statistics API. The read_waterdata_stats_por function
retieves day-of-year and month-of-year daily data statistics from the
observationNormals endpoint. The
read_waterdata_stats_daterange function retieves calendar
month, calendar year, and water year daily data statistics from the
observationIntervals endpoint.
discharge_stats_por <- read_waterdata_stats_por(
  monitoring_location_id = "USGS-05428500",
  parameter_code = "00060"
)

discharge_stats_daterange <- read_waterdata_stats_daterange(
  monitoring_location_id = "USGS-05428500",
  parameter_code = "00060"
)
Water Quality Portal Web Retrievals
Water quality data sets available from the Water Quality Data Portal.
These data sets can be housed in either the STORET database (data from
EPA) and NWIS database (data from USGS). Because only USGS uses
parameter codes, a “characteristic name” must be supplied. The
readWQPqw function can take either a USGS parameter code,
or a more general characteristic name in the parameterCd input argument.
The Water Quality Data Portal includes data discovery tools and
information on characteristic names. The following example retrieves
specific conductance from a DNR site in Wisconsin.
specificCond <- readWQPqw(
  "WIDNR_WQX-10032762",
  "Specific conductance",
  "2011-05-01", "2011-09-30"
)
WQP
Just as with NWIS, the Water Quality Portal (WQP) offers a variety of ways to search for sites and request data. The possible Web service arguments for WQP site searches is found here.
Sites: whatWQPsites
To discover available sites in the WQP in New Jersey that have
measured Chloride, use the function whatWQPsites.
sitesNJ <- whatWQPsites(
  statecode = "US:34",
  characteristicName = "Chloride"
)
Data: readWQPdata
To get data from the WQP using generalized Web service calls, use the
function readWQPdata. For example, to get all the pH data
in Wisconsin:
dataPH <- readWQPdata(
  statecode = "US:55",
  characteristicName = "pH"
)
Availability: whatWQPdata
The function whatWQPdata returns a data frame with
information on the amount of data collected at a site. For example:
type <- "Stream"
sites <- whatWQPdata(countycode = "US:55:025", siteType = type)
This returns a data frame with all of the sites that were measured in
streams in Dane County, WI. Also, in that table, there is a measure of
activityCount (how often the site was sampled), and
resultCount (how many individual results are
available).
Samples: whatWQPsamples
The function whatWQPsamples returns information on the
individual samples collected at a site. For example:
site <- whatWQPsamples(siteid = "USGS-01594440")This returns one row for each instance that a sample was collect.
Metrics: whatWQPmetrics
The function whatWQPmetrics provides metric information.
This is only currently available for STORET data:
type <- "Stream"
sites <- whatWQPmetrics(countycode = "US:55:025", siteType = type)
Getting Started in R
This section describes the options for downloading and installing the
dataRetrieval package.
New to R?
If you are new to R, you will need to first install the latest version of R, which can be found [here] (www.R-project.org).
At any time, you can get information about any function in R by typing a question mark before the functions name. This will open a file (in RStudio, in the Help window) that describes the function, the required arguments, and provides working examples. This will open a help file similar to the image below. To see the raw code for a particular code, type the name of the function, without parentheses.
?read_waterdata_parameter_codes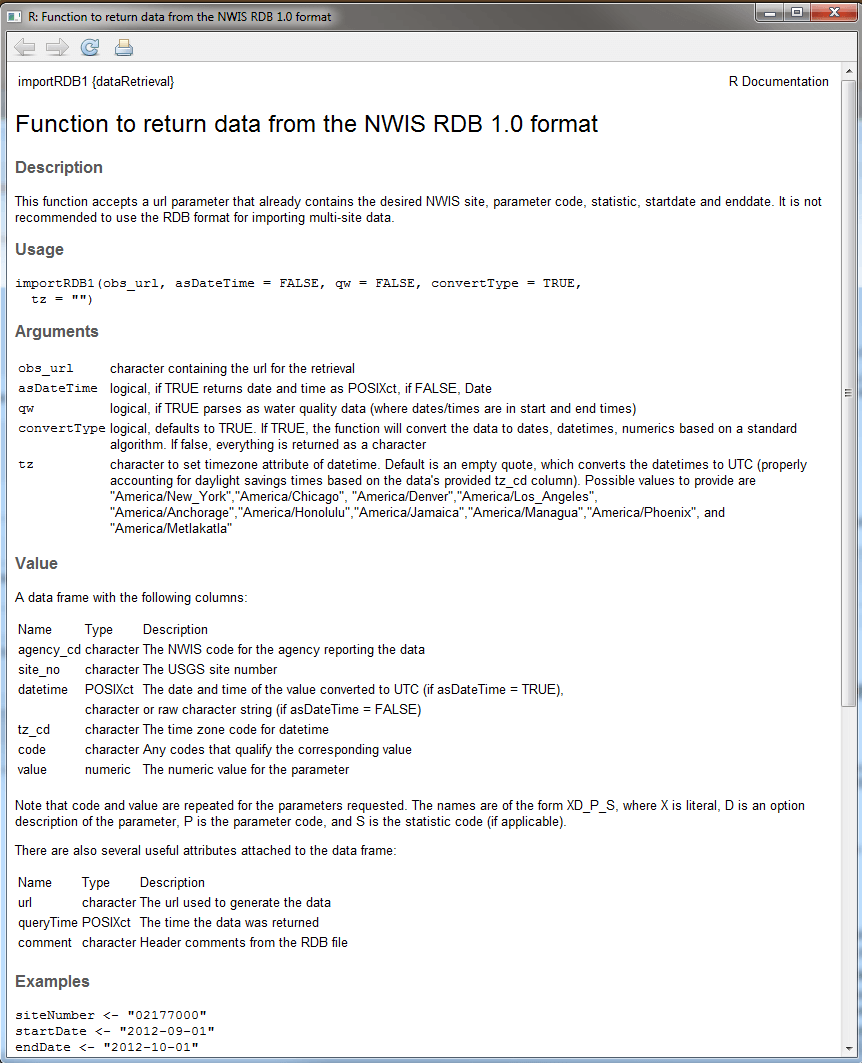
Additionally, many R packages have vignette files attached (such as this paper). To see the list of vignettes in a package:
Citations
Citing the dataRetrieval package
citation(package = "dataRetrieval")## To cite dataRetrieval in publications, please use:
##
## De Cicco, L.A., Hirsch, R.M., Lorenz, D., Watkins,
## W.D., Johnson, M., Blodgett, D.L., Hinman, E.D.,
## Zemmels, J., 2026, dataRetrieval: R packages for
## discovering and retrieving water data available
## from Federal hydrologic web services, v.2.7.25,
## doi:10.5066/P9X4L3GE
##
## A BibTeX entry for LaTeX users is
##
## @Manual{,
## author = {Laura DeCicco and Robert Hirsch and David Lorenz and Jordan Read and Jordan Walker and Lindsay Platt and David Watkins and David Blodgett and Mike Johnson and Aliesha Krall and Lee Stanish and Joseph Zemmels and Elise Hinman and Michael Mahoney},
## title = {dataRetrieval: R packages for discovering and retrieving water data available from U.S. federal hydrologic web services},
## publisher = {U.S. Geological Survey},
## address = {Reston, VA},
## version = {2.7.25},
## institution = {U.S. Geological Survey},
## year = {2026},
## doi = {10.5066/P9X4L3GE},
## }Citing NWIS data
The requested format is:
U.S. Geological Survey, 2023, National Water Information System data available on the World Wide Web (USGS Water Data for the Nation), accessed [April 26, 2023], at https://dx.doi.org/10.5066/F7P55KJN
This can be created from the attributes of the data using the
create_NWIS_bib function:
dv <- read_waterdata_daily(monitoring_location_id = "USGS-04085427",
                           parameter_code = "00060",
                           time = c("2012-01-01", "2012-06-30"))

NWIScitation <- create_NWIS_bib(dv)
NWIScitation
U.S. Geological Survey (2026). _USGS Water Data for the Nation: U.S. Geological Survey
National Water Information System database_. doi:10.5066/F7P55KJN
<https://doi.org/10.5066/F7P55KJN>, Accessed Mar 09, 2026.Alternative output is available:
print(NWIScitation, style = "Bibtex")@Manual{,
title = {USGS Water Data for the Nation: U.S. Geological Survey National Water Information System database},
author = {{U.S. Geological Survey}},
doi = {10.5066/F7P55KJN},
note = {Accessed Mar 09, 2026},
year = {2026},
}
print(NWIScitation, style = "citation")U.S. Geological Survey, 2024, National Water Information System
data available on the World Wide Web (USGS Water Data for the
Nation), accessed Feb 09, 2024, at
https://waterservices.usgs.gov/nwis/dv/?site=09010500&format=waterml,1.1&ParameterCd=00060&StatCd=00003&startDT=1851-01-01,
https://dx.doi.org/10.5066/F7P55KJN
A BibTeX entry for LaTeX users is
@Manual{,
title = {National Water Information System data available on the World Wide Web (USGS Water Data for the Nation)},
author = {{U.S. Geological Survey}},
doi = {10.5066/F7P55KJN},
note = {Accessed Feb 09, 2024},
year = {2024},
url = {https://waterservices.usgs.gov/nwis/dv/?site=09010500&format=waterml,1.1&ParameterCd=00060&StatCd=00003&startDT=1851-01-01},
}Citing WQP data
Citations for specific datasets should use this format:
National Water Quality Monitoring Council, YYYY, Water Quality Portal, accessed mm, dd, yyyy, hyperlink_for_query, https://doi.org/10.5066/P9QRKUVJ.
This can be obtained using the create_WQP_bib
function:
SC <- readWQPqw(siteNumbers = "USGS-05288705",
                parameterCd = "00300")

WQPcitation <- create_WQP_bib(SC)
WQPcitation
National Water Quality Monitoring Council (2024). _ Water
Quality Portal_. doi:10.5066/P9QRKUVJ
<https://doi.org/10.5066/P9QRKUVJ>, Accessed Feb 09, 2024,
<https://www.waterqualitydata.us/data/Result/search?siteid=USGS-05288705&pCode=00300&mimeType=tsv&zip=yes>.
print(WQPcitation, style = "Bibtex")@Manual{,
title = { Water Quality Portal},
author = {{National Water Quality Monitoring Council}},
doi = {10.5066/P9QRKUVJ},
note = {Accessed Feb 09, 2024},
year = {2024},
url = {https://www.waterqualitydata.us/data/Result/search?siteid=USGS-05288705&pCode=00300&mimeType=tsv&zip=yes},
}
print(WQPcitation, style = "citation")National Water Quality Monitoring Council, 2024, Water Quality
Portal, accessed 02, 09, 2024,
https://www.waterqualitydata.us/data/Result/search?siteid=USGS-05288705&pCode=00300&mimeType=tsv&zip=yes,
https://doi.org/10.5066/P9QRKUVJ.
A BibTeX entry for LaTeX users is
@Manual{,
  title = { Water Quality Portal},
  author = {{National Water Quality Monitoring Council}},
  doi = {10.5066/P9QRKUVJ},
  note = {Accessed Feb 09, 2024},
  year = {2024},
  url = {https://www.waterqualitydata.us/data/Result/search?siteid=USGS-05288705&pCode=00300&mimeType=tsv&zip=yes},
}Citing Water Quality Portal itself
General Water Quality Portal citations should use the following:
Water Quality Portal. Washington (DC): National Water Quality Monitoring Council, United States Geological Survey (USGS), Environmental Protection Agency (EPA); 2021. https://doi.org/10.5066/P9QRKUVJ.
Disclaimer
This information is preliminary and is subject to revision. It is being provided to meet the need for timely best science. The information is provided on the condition that neither the U.S. Geological Survey nor the U.S. Government may be held liable for any damages resulting from the authorized or unauthorized use of the information.